Introduction
Cordys servers are a very complicated environment including
lot of different JVM's (java virtual machines) and lot of connections to databases
and other external systems, and in a Cordys cluster, different Cordys
instances.
Therefore Cordys servers can run in trouble for many
reasons, for example:
- Maximum heap memory exceeded
- Broken connections
- Load too high
- Lack of memory
- Slow database
- Check if heap memory usage is not exceeding maximum memory
- Check if it is available and restart it if necessary
- Check the performance of its webservices
- Check the performance of the databases used by the service container
Another task of the Cordys administrator is to optimize
performance by adding more resources. For this the administrator needs to know
the bottlenecks and the peak loads. So he needs lot of data accumulated over
large periods and visualized in clear graphs.
So Cordys administrators needs a monitoring tool helping him
to detect problems fast and to analyze trends of resource usages. This
monitoring tool must be able to do the following:
- Send alerts (mail and sms) when a critical threshold is exceeded
- Data accumulated over large periods of time
- Show clear graphs
- Provide a dashboard summarizing the health of the Cordys server
- The graphs must support drilldown: after the problem is found it must be possible to get more details about the problem by clicking on the graphs
Unfortunately Cordys does not provide such a monitoring
tool. But Cordys supports JMX offering lot of information about the performance
of the service containers. These JMX counters can be monitored in a tool
supporting JMX.
Most customers only use JConsole of JVisualVM for monitoring
these counters. However these tools have important limitations:
- No data aggregation over large periods of time
- Very limited dashboard en graph options
- Lot of knowledge required for addressing the right counters and visualizing them
Hyperic User Interface
Dashboard
The dashboard is an overall view of the server's health and has a menu for looking up and creating monitored resources and their alerts. The dashboard is implemented as a portal with portlets showing different aspects of the resources.
Auto discovery
The Auto-Discovery portlet shows all resources found on the server. The administrator can select them and add them to the set of resources monitored by Hyperic. Thanks to the Cordys plugin the auto discovery is also able to locate the Cordys Service Containers, see the screenshot below for an example:
Note: This autodiscovery plugin has been written by Ciber
Recent Alerts
The Recent Alerts portlets shows all spawned alerts. After solving the cause of these alerts the administrator can mark them here as fixed.
Alerts
can be triggered, for example, when a service container is not available or
when the heap memory exceeded a critical threshold. The application
administrator will receive an email or an sms so that he can fix the problem
fast.
Resources, Groups and Graphs
Hyperic shows graphs for every available metric for both
groups and individual resources. The graphs of the groups are an aggregation of
its members. This group view enables for a quick analysis of bottlenecks and
drilldowns.
First analyze the metrics on group level: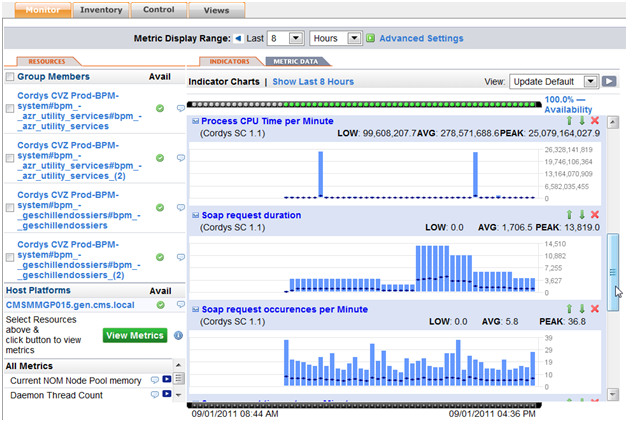
Conclusion
Hyperic together with the Ciber plugin is a perfect tool to monitor the Cordys resources and can proactively warn administrators that something is (going) wrong, before the system is down, or that business processes are halted.
Businesses today rely heavily on their networks. If the network is down, even for a short period, it can result in lack of productivity. A monitoring solution is necessary to find and fix issues as quickly as possible.
BeantwoordenVerwijderenHi Roger,
BeantwoordenVerwijderenI installed succesfully the Hyperic open source server and agent. When I run the agent, it is not detecting CORDYS resources. Is there any specific plugin to be installed for doing this?Please help me inconfiguring hyperic for auto discovery of CORDYS service containers?
Thanks & regards,
Bharathi
Hello Bharathi,
VerwijderenIndeed you need plugins that are developed by Ciber. With this plugin you have the auto-discover mechanism. Unfortunately because Ciber developed these plugins i can not give them to you (for free).
If your company is interested I can help with the contact with Ciber.
Regards, Roger
Thanks you for the quick response..
VerwijderenActually I am doing this with my personal interest..
Can you please help me out in building custom plugins.
Thanks & Regards,
Bharathi.
Unfortunately I did not develop those plugins.
VerwijderenTip: Please read through the Hyperic documentation and the Cordys documentation. You can use java calls to interrogate the Cordys service containers.